
iotap
Trace a process’s file and network I/O on macOS and Linux.
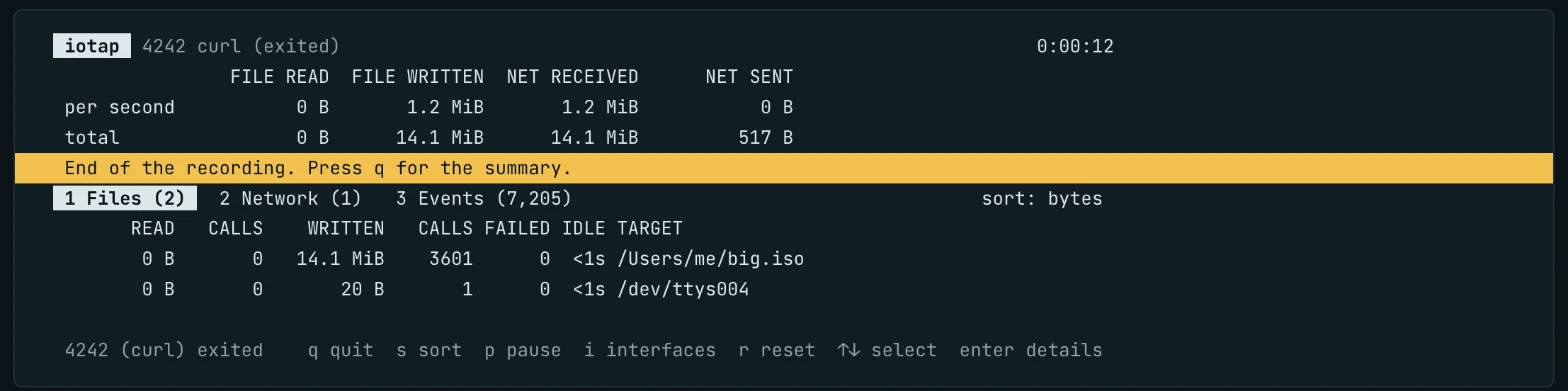
Follow the bytes
When a build stalls or a process fills the disk, I want to know which file or connection accounts for the time. Give iotap a process name or PID to see paths, endpoints, bytes, latency, and failures as they happen. Stop the trace and it adds up the calls for each file and endpoint.
Read a recording several ways
iotap reads kernel events through kdebug on macOS and eBPF on Linux. A recording holds the metadata for each call. Replay it on the same operating system to examine a per-file summary, follow the event stream, or open the interactive dashboard. The replay runs with ordinary user permissions.
Features
- Trace by PID or by name, follow the processes a traced one starts, and filter file or network traffic and interfaces.
- An event stream, a per-target summary, JSON Lines for jq or a log, or a terminal UI with files, endpoints, and the latest 10,000 events.
- Record a trace and replay it later, in any of those forms, without root.
- On macOS, OS-measured TCP and UDP traffic including Skywalk, kept separate from the syscall byte counts.